NetFlow Monitoring: Data, Design, and Security Analytics
Learn how NetFlow monitoring works, which records to collect, how exporters and collectors fit together, and how security teams analyze flow data.
NetFlow monitoring turns network conversations into structured records that can be stored and analyzed at much lower volume than full packet capture. A flow record commonly describes who communicated, with whom, over which protocol and ports, when, through which observation point, and how many packets and bytes were counted. It usually does not contain the application payload.
That tradeoff makes flow data useful for broad and longer-term visibility, including on links where packet retention is impractical or most traffic is encrypted. It also creates limits: a record is a summary created by a particular exporter under a particular key, timeout, sampling policy, direction, and template. Analysts must know those conditions before treating a row as a complete connection history.
This guide explains NetFlow data, exporters, probes, monitors, collectors, IPFIX, deployment design, cybersecurity analytics, detection patterns, operational health, privacy, retention, and tool evaluation. It is written for teams deciding what to collect and what conclusions that collection can actually support.
A Flow Is a Defined Group of Packets
A flow is not a universal object waiting on the wire. The exporter groups packets according to configured key fields. A traditional five-tuple uses source address, destination address, source port, destination port, and protocol; direction, interfaces, VLANs, class of service, or other fields may also separate records.
Non-key fields are collected as properties or counters. These can include start and end time, packet and byte totals, TCP flags, next hop, autonomous-system information, application identifiers, or vendor-specific elements. If two products use different keys, timeouts, or information elements, their “flow counts” may not be directly comparable.
Cisco’s current Flexible NetFlow documentation separates the flow record, which defines cache keys and collected fields, from the flow monitor and exporter. Document that configuration alongside the data.
Exporters, Probes, Monitors, and Collectors Have Different Jobs
The observation point is where packets are visible. A metering process groups and measures them. An exporter encodes and sends records. A collector receives templates and data records, decodes them, validates context, and stores or forwards them. Analytics then enrich and query the retained data.
Network devices may export natively. A dedicated probe can generate records from a TAP, packet broker, virtual switch, cloud mirror, or other authorized traffic source. Cisco Flexible NetFlow uses a monitor to combine a record definition, cache, and exporter and applies that monitor to interfaces and directions.
Design for failure. Export commonly uses UDP, so delivery is not inherently guaranteed. Collector overload, exporter queue pressure, template loss, network loss, restarts, clock errors, and configuration changes can all create silent gaps. Monitor sequence behavior, exporter statistics, template state, record rates, and the difference between expected and observed coverage.
NetFlow Versions and IPFIX Are Related but Not Interchangeable
NetFlow v5 has a fixed record layout and remains common in older environments. NetFlow v9 introduced template-based export, allowing record layouts to be described before data records use them. IPFIX standardized an extensible template-based protocol and information model.
RFC 7011 specifies how IPFIX exporters transmit Template, Options Template, and Data Records to collectors. RFC 7012 defines the information-model rules, while IANA maintains the normative information-element registry. Enterprise-specific fields can extend the model, which is useful but can reduce portability.
A collector must receive the correct template in the correct observation domain to decode subsequent data. Preserve exporter identity, observation-domain context, template identifiers, and protocol version during normalization. Mapping all inputs to a smallest common schema can discard the fields that justified collecting richer telemetry.
Place Flow Monitoring Where It Answers a Defined Question
Start with decisions: internet ingress and egress visibility, internal segmentation, data-center paths, branch connectivity, cloud workloads, remote access, management networks, or critical-service dependencies. Then identify which observation points see both directions and which address translation, load balancing, tunneling, or asymmetric routing changes identity along the path.
Collecting from every interface can duplicate records and overwhelm storage without adding knowledge. Collecting only at the perimeter misses lateral movement and internal service relationships. Choose coverage deliberately, label observation points, and define whether ingress, egress, or both directions are enabled.
CISA’s current communications-infrastructure visibility guidance recommends strategically positioning flow exporters and collectors around key ingress and egress locations. Apply the principle to your architecture rather than copying a universal sensor count.
What NetFlow Security Analytics Can Detect
Flow analytics can reveal new or rare communication pairs, unexpected services, denied-but-retried paths, scanning fan-out, unusual fan-in, periodic connections, long-lived low-volume sessions, abrupt volume changes, rare destinations, protocol-port mismatches, and movement between zones that normally do not communicate. For a focused method that combines these patterns with process, DNS, TLS, identity, and response evidence, use the command-and-control detection and response guide.
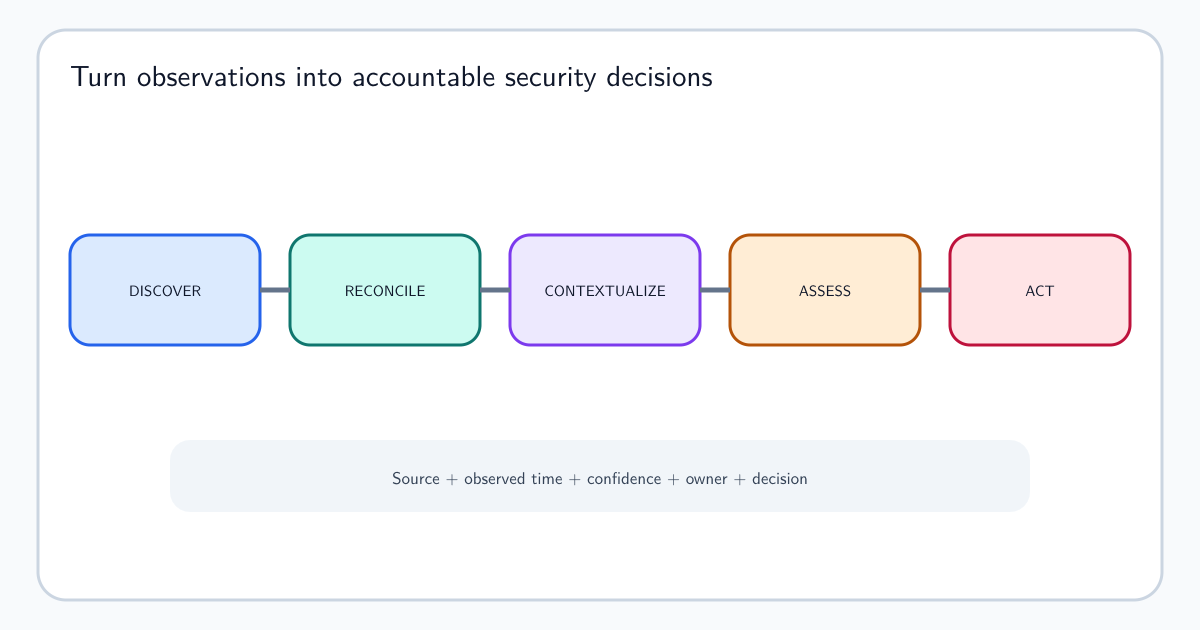
Use these as investigation leads, not automatic verdicts. Backups can look like exfiltration; monitoring can look like scanning; load balancers can distort client identity; content delivery can create rare destinations; and application retry logic can create periodic traffic. Add asset role, direction, network zone, identity, change window, DNS, proxy, authentication, and endpoint evidence. A cybersecurity asset intelligence workflow helps reconcile those observations with stable identities, owners, dependencies, freshness, and source confidence.
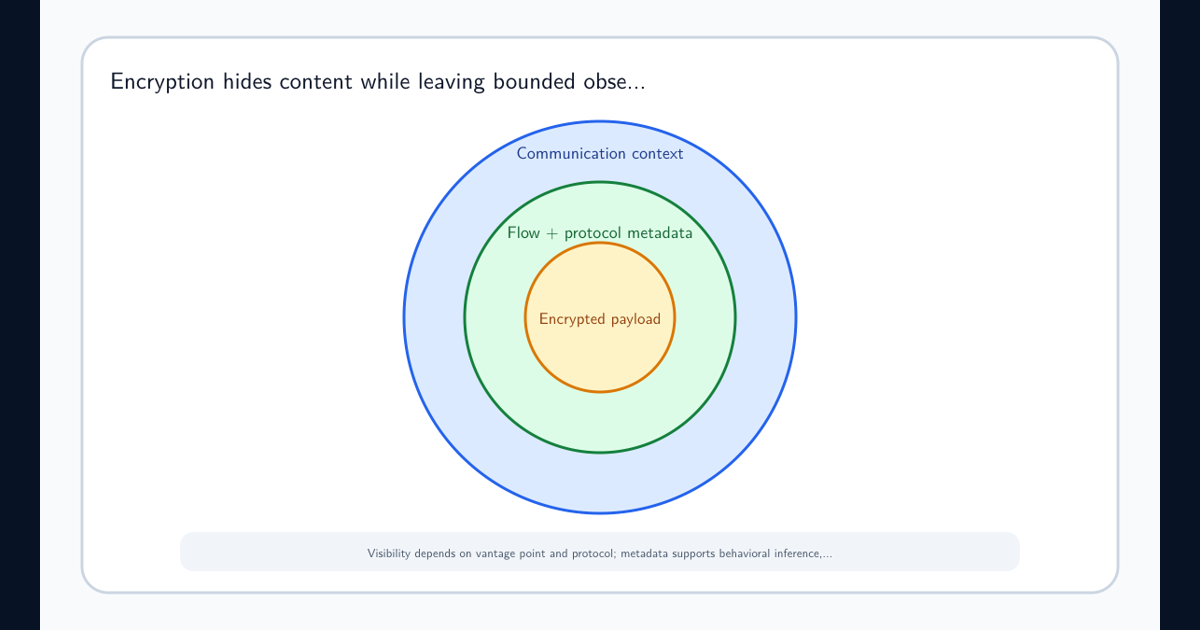
For encrypted communications, flow metadata preserves timing, endpoints, direction, and volume but not intent or payload. The encrypted-traffic metadata guide explains those analytical limits in depth.
Build Detections Around Stable Behavior and Coverage
Define the entity, population, baseline window, minimum coverage, threshold, exclusions, and response for each analytic. A source contacting many destinations may indicate discovery; a server suddenly initiating outbound sessions may violate its role; sustained outbound bytes after an unusual login may support a data-movement hypothesis.
Normalize time, addresses, ports, protocol, direction, exporter, interface, observation domain, sampling, packet and byte counts, and flow-end reason before comparing records. Account for active and inactive timeouts because one long communication may be split across several records.
Test with known activity and failure cases. Measure precision, recall where observable, investigation yield, collection gaps, late arrival, duplicates, and sensitivity to configuration change. A detector that goes quiet after an exporter failure is not evidence that the network became safe.
Monitor the Monitoring System
Track configured exporters, expected interfaces and directions, template arrival, record volume, packets and bytes, exporter uptime, sequence gaps where applicable, queue drops, collector decode errors, unknown information elements, clock offset, storage delay, and schema changes.
Compare telemetry against independent network facts such as interface counters, routing changes, maintenance records, packet-broker health, and cloud-flow-log status. A sudden fall in flow volume can mean lower traffic, a failed exporter, a template problem, a routing change, or an overloaded collector.
Version record definitions and retain change history. Detection baselines can break when a key, timeout, sampler, interface assignment, application classifier, or firmware behavior changes even if the export service remains up.
Know What Flow Data Cannot Prove
Flow data normally cannot show message content, commands, transferred files, user intent, application semantics, or whether encrypted bytes were malicious. NAT, proxies, VPNs, tunnels, shared services, and load balancers can hide or transform endpoints. Export location determines which identity is visible.
Sampling can miss short activity and distorts absolute counts. Timeouts split communications. UDP lacks connection state. Asymmetric routing can show only one direction. Retention and aggregation can remove detail needed later. Vendor-defined fields and classifiers may be inconsistent.
Treat flow as one evidence layer alongside DNS investigation records, authentication, endpoint telemetry, application logs, proxy data, packet capture, and configuration history. State the observation boundary in every conclusion.
Govern Retention, Access, and Sensitive Network Metadata
Flow records can reveal relationships, service use, working patterns, internal architecture, and investigative targets even without payload. Define collection purpose, legal basis, access roles, retention, permitted enrichment, export restrictions, and audit requirements before centralizing long histories.
Limit fields and retention to justified use cases, separate operational from investigative access, protect exporter-to-collector paths, authenticate where supported, encrypt transport where the implementation permits it, and secure stored records. Do not send sensitive internal topology to an unmanaged external collector merely because the records lack content.
Balance incident-history needs against privacy, storage, and breach impact. Aggregation can serve capacity reporting while detailed records remain available for a shorter security window.
Evaluate NetFlow Monitoring Tools With Your Own Data
Test support for your actual NetFlow versions, IPFIX templates, enterprise elements, exporter scale, record rates, sampling, IPv6, tunnels, cloud sources, high availability, buffering, schema evolution, access controls, retention, enrichment, search, detection, export, and health telemetry.
Replay representative records and controlled network activity. Verify template handling, direction, time, duplicate behavior, late data, NAT context, and failure recovery. Measure sustained ingestion and query performance with realistic cardinality rather than vendor demonstration data.
Choose architecture from use cases: troubleshooting, capacity planning, security analytics, incident scoping, or long-term baselining require different fields and retention. A strong product cannot recover fields the exporter never collected or traffic the observation point never saw.
NetFlow Deployment Checklist
Define decisions and observation points. Document keys, fields, timeouts, directions, versions, templates, sampling, and exporter identities. Protect the export path. Size collectors for peak records. Preserve raw context before normalization. Monitor gaps and schema changes. Enrich with governed asset and network identity. Validate analytics with known behavior.
Review coverage after routing, cloud, segmentation, device, or firmware changes. Keep a data dictionary that explains each normalized field and its source. Train analysts to distinguish absence of a record from evidence that communication did not occur.
The practical rule is: know where the record was observed, how the flow was defined, which packets could be missed, and what independent evidence supports the conclusion.
Frequently asked questions
What is NetFlow?
NetFlow is a Cisco-developed approach for grouping packets into flows, maintaining counters and metadata for those flows, and exporting records to a collector. Flexible NetFlow lets operators define the keys that identify a flow and the fields that are collected.
Does NetFlow capture packet payloads?
Ordinary NetFlow records summarize communications; they do not preserve full packet payloads. Depending on the exporter and record definition, data may include addresses, ports, protocol, interfaces, timestamps, byte and packet counts, flags, and other metadata.
What is the difference between NetFlow and IPFIX?
NetFlow refers to Cisco flow technology and its export versions. IPFIX is an IETF-standard protocol and information model derived from NetFlow version 9 concepts. Products may support NetFlow v5, v9, IPFIX, or vendor extensions with different fields and behavior.
What is a NetFlow probe?
A probe observes traffic, converts it into flow records, and exports those records. Some network devices export natively; external probes may observe a TAP, packet broker, virtual network, or cloud traffic source.
How is NetFlow used in cybersecurity?
Security teams use flow data to baseline communications, find unexpected services and paths, identify scanning or beacon-like patterns, scope incidents, measure data movement, and investigate encrypted traffic where payload inspection is unavailable.
Does sampled NetFlow show every connection?
No. Sampling observes a subset of packets or flows and changes what can be inferred, especially for short or low-volume activity. Record the sampling method and rate, validate its effect, and avoid presenting sampled counts as complete traffic counts.