Choosing an Analytic: Match, Threshold, Sequence, Graph, Baseline, or Risk Score
Choose a match, threshold, sequence, graph, baseline, or risk model by the security claim you need to support—not by which feature a platform makes easiest to deploy.
Begin with the relationship you need to preserve
An analytic is a way of evaluating evidence. Its form should follow the claim you need to make. If one event contains a sufficiently distinctive state change, a match may be enough. If concern grows with repeated actions, you need a count. If order matters, you need a sequence. If several identities and resources form the behavior, a graph may preserve relationships that a flat query would erase.
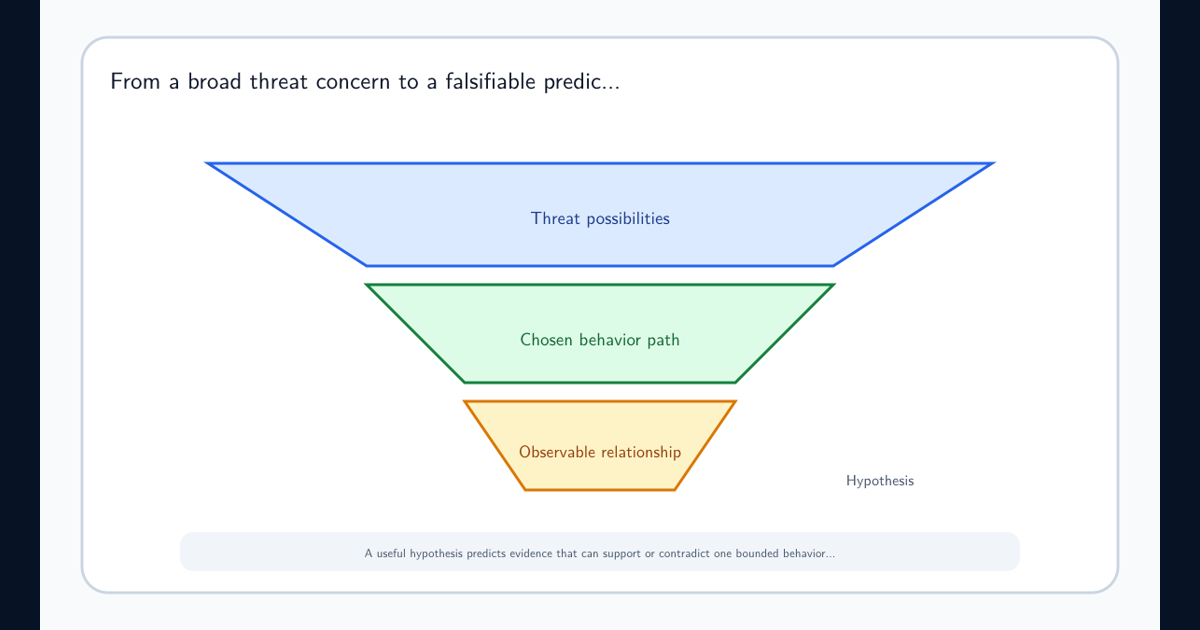
This is why “Which detection type is best?” is the wrong opening question. Start with the detection hypothesis. Ask whether the prediction depends on presence, amount, order, relationship, deviation from expectation, or accumulation of weak evidence. The answer points toward an analytic form.
Prefer the least complex form that keeps the necessary meaning. Complexity creates more state to maintain, more boundaries to explain, and more ways for late or duplicated data to change a result. A sequence is not more mature than a match when one authoritative event already records the consequential action.
Matches and thresholds answer different questions
A match asks whether an event or state satisfies conditions. It works well when the event meaning is strong: a protected policy was disabled, a decoy credential was used, or a new owner was assigned to a sensitive application. Its weakness is not simplicity. Its weakness appears when the condition is only loosely related to the security concern.
A threshold asks whether a count, amount, or distinct-value total crosses a boundary within a population and period. Ten failures by one identity in five minutes makes a different claim from one failure. You must explain the grouping key, window, deduplication behavior, and why the number changes the decision.
Thresholds can hide arbitrary tuning. Choosing ten because nine creates too many alerts is workload management, not evidence that ten is threatening. Retries can inflate counts, distributed activity can remain below per-entity boundaries, and delayed records can fall outside the window. The result should expose those assumptions rather than presenting the boundary as a natural fact.
Sequences and graphs preserve structure
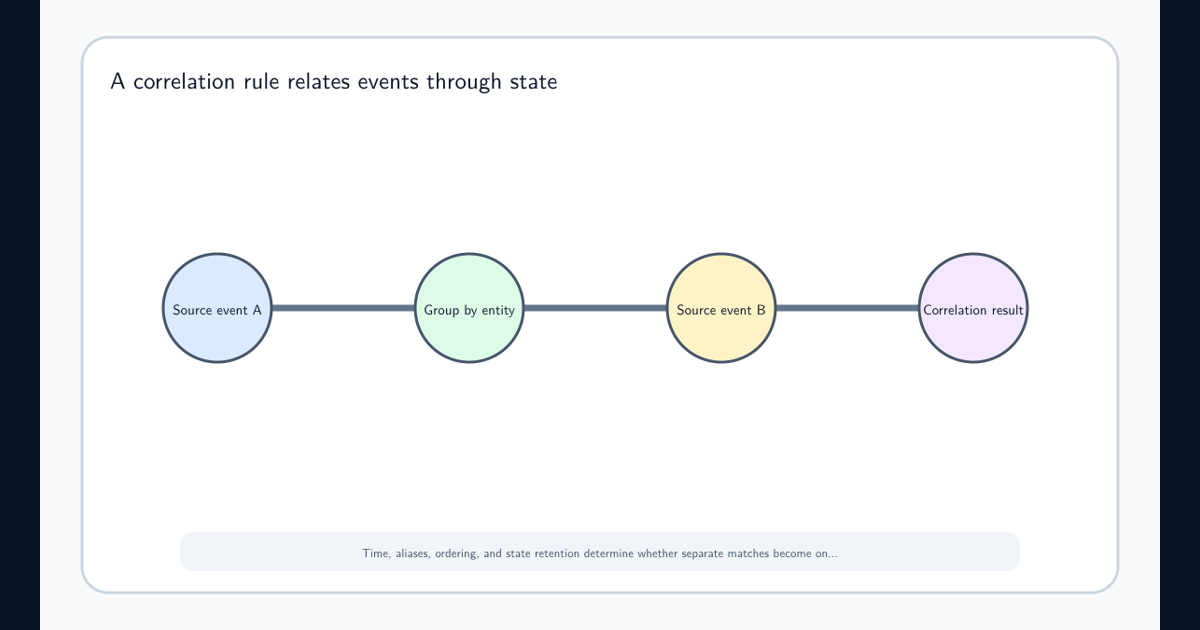
A sequence evaluates whether events occur in an expected order within a time window. A new OAuth grant followed by mail access supports a different interpretation from the same two events weeks apart. The sequence needs stable entity keys and explicit handling of overlap, missing steps, retries, and out-of-order arrival.
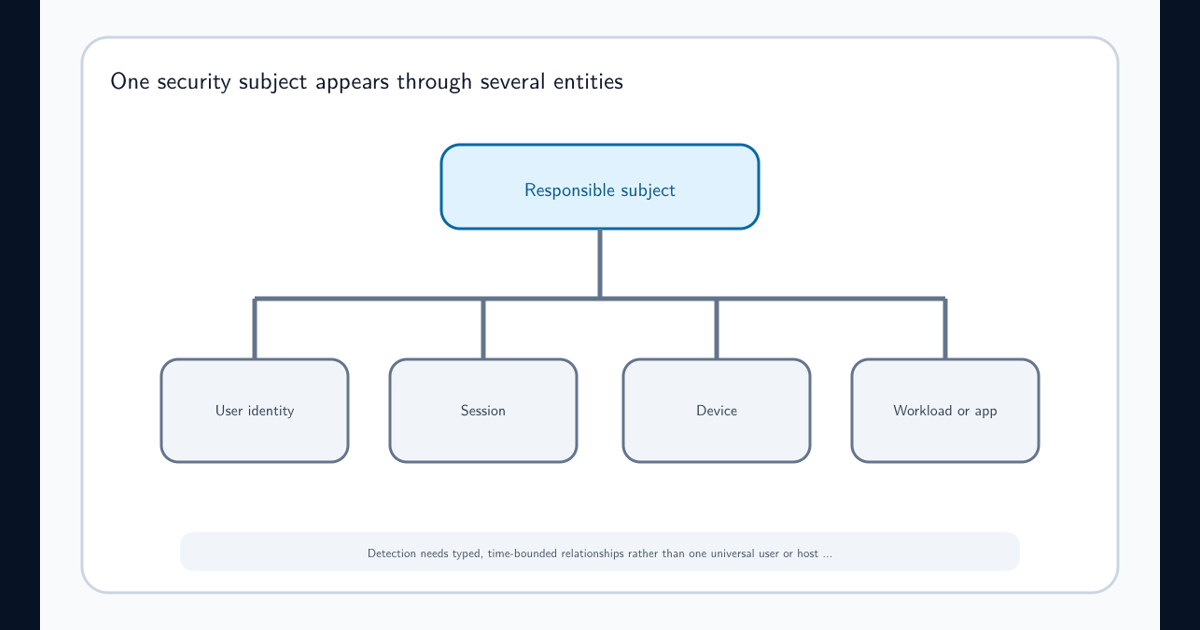
A graph analytic evaluates relationships among entities such as users, sessions, applications, hosts, and resources. It can reveal that several accounts share one newly registered device or that one application connects otherwise separate incidents. The edges must have security meaning. Merely drawing events as a graph does not create causality.
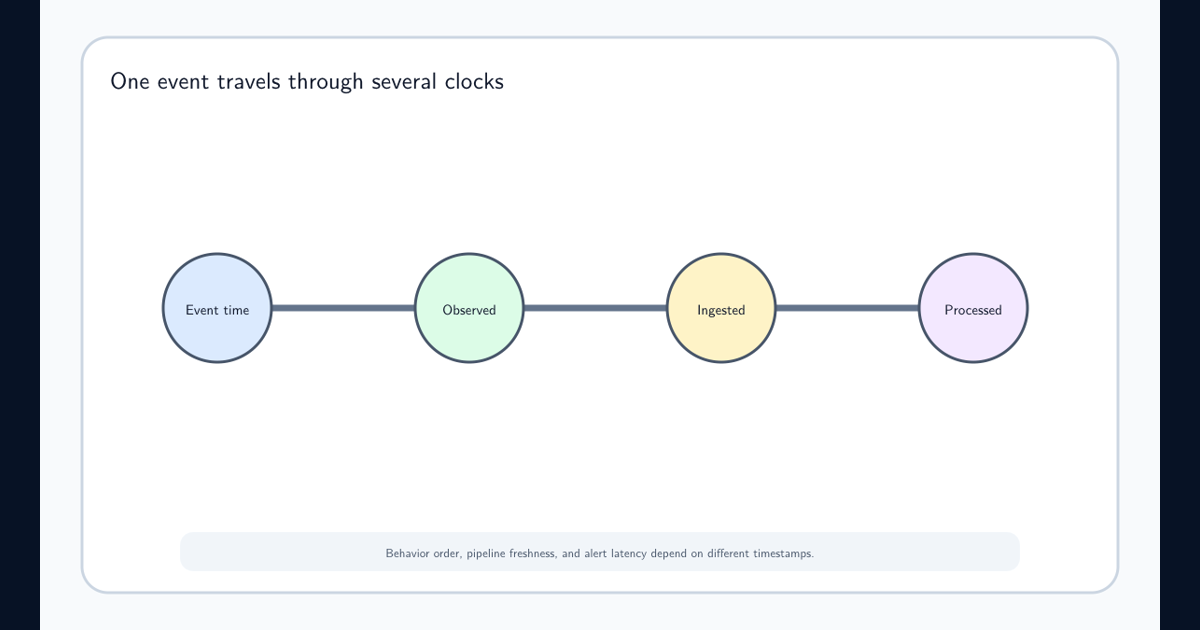
Both forms can look persuasive because they show structure. Keep event time separate from ingest time, distinguish observed edges from inferred ones, and identify which relationship would break the claim if it were wrong. A shared address behind a corporate proxy is not equivalent to a shared authenticated session. Structure helps only when its semantics survive the join.
Baselines and risk scores make comparison choices
A baseline describes expected behavior for a defined population and period. It may reveal a new administrator, an unusual data volume, or access outside a peer group’s pattern. “Unusual” is not the same as malicious. Organizational change, sparse history, seasonal work, and a badly chosen peer group can all produce deviation.
A risk model assigns contributions to evidence and accumulates them for an entity. This can delay interruption until several weak observations form a stronger case. It can also double-count correlated detections, attach evidence to the wrong identity, or let one arbitrary weight dominate every result.
These forms require explainability. Show the comparison population, history period, freshness, contributing observations, weights, decay, and dependencies. A consumer should be able to reconstruct why this entity crossed the boundary now. If the explanation is only “the model score was high,” the analytic has hidden the premises needed for a security decision.
Judge the form by the decision it improves
Compare candidate forms against the same requirement. Does each represent the necessary behavior? Can the available telemetry supply its state and timing? How quickly can it produce a result? Can the consumer verify the evidence? What happens when data is missing, late, duplicated, or misjoined? How cheaply can an attacker alter the features it relies on?
You may combine forms, but each addition should have a job. A match can create a strong risk contribution. A sequence can provide a case-level result. A graph can enrich that result with related entities. Combining them without separating their claims creates a complicated score that nobody can challenge.
The final choice is an engineering argument: this is the simplest mechanism that preserves the relationship required by the hypothesis, given these sources, consumers, latency needs, and known limits. That explanation remains useful when the query language or platform changes, because it records why the analytic exists rather than merely how it was expressed.
Frequently asked questions
Which analytic form is best for detection engineering?
There is no universally best form. Use the simplest form that represents the necessary relationship in the hypothesis, then make its grouping, time, state, and uncertainty visible to the consumer.