
Introduction
Every CTI analyst has a favourite hypothesis. The first explanation that comes to mind when an alert fires. The one that feels right based on experience. The one you start building evidence around before you have considered alternatives. That is confirmation bias – the single biggest source of intelligence failure I have seen across a decade of CTI work.
Analysis of Competing Hypotheses – ACH – is the structured technique that forces you to consider multiple explanations and evaluate evidence systematically rather than intuitively. I learned it from intelligence community methodology and have adapted it for cyber threat analysis. It is not fast. It is not exciting. It is the most reliable way to produce intelligence assessments that hold up under scrutiny. This guide walks through the full ACH process with a real cyber investigation example.
For the broader CTI methodology context, the Diamond Model and Cyber Kill Chain guides cover complementary structured analysis frameworks.
The ACH Process Step by Step
ACH has eight steps. You can do them in a spreadsheet, a MISP instance, or a structured document. The tool does not matter. The discipline matters. I have used ACH on attribution assessments, campaign analyses, and incident investigations. The process is the same regardless of the question.
Step 1: Identify the hypotheses. List every possible explanation for what you are observing. Not just the one you believe. Not just the likely ones. Every explanation that is logically possible. For an intrusion investigation, your hypotheses might be: state-sponsored espionage, financially motivated crime, hacktivism, insider threat, or a false positive. Write them all down. The discipline is in listing the ones you do not believe.
Step 2: List the evidence. Document every piece of evidence you have – malware analysis results, infrastructure data, targeting patterns, timing, victimology. Include evidence that supports your preferred hypothesis and evidence that contradicts it. Include evidence that you expected to find but did not – the absence of expected evidence is itself evidence. Number each evidence item for the matrix.
Step 3: Build the matrix. Create a grid with hypotheses as columns and evidence as rows. For each evidence-hypothesis intersection, mark whether the evidence is consistent, inconsistent, or neutral. Be ruthless about neutrality. “The adversary used PowerShell” is neutral for almost every hypothesis because almost every actor uses PowerShell. Reserve consistent and inconsistent for evidence that genuinely discriminates between hypotheses.
Step 4: Refine the matrix. Review your initial assessments. Are you being harder on hypotheses you do not like? Easier on the one you prefer? Delete evidence items that do not discriminate – if an item is neutral across all hypotheses, it adds no analytical value. Consider whether you need to split or merge hypotheses based on what the evidence shows.
Step 5: Draw tentative conclusions. Which hypothesis has the most consistent evidence and the fewest inconsistencies? That is your leading hypothesis – not because it feels right, but because the evidence matrix says so. State your confidence level explicitly. High confidence requires multiple corroborating sources. Moderate means plausible but not fully corroborated. Low means possible but unconfirmed.
Step 6: Analyse sensitivity. Ask yourself: what single piece of evidence, if it turned out to be wrong, would change my conclusion? If your conclusion depends heavily on one indicator, your confidence should drop. The most robust conclusions are supported by multiple independent lines of evidence where no single item is load-bearing.
Step 7: Report conclusions. Present your leading hypothesis with its confidence level. Present the alternatives and explain why they are less likely. Be transparent about the evidence gaps and uncertainties. An ACH report that says “we assessed with moderate confidence that this intrusion was financially motivated based on the targeting pattern and malware analysis, but we cannot exclude the possibility of a false flag operation” is a professional intelligence product. “We think it is a criminal group” is not.
Step 8: Track outcomes. Record what you predicted and what actually happened. This is the step most analysts skip. It is also the step that makes you better over time. When new evidence emerges, revisit your ACH matrix. Did your conclusion hold up? If not, what did you miss? Tracking your analytical track record is how you calibrate your own judgment.
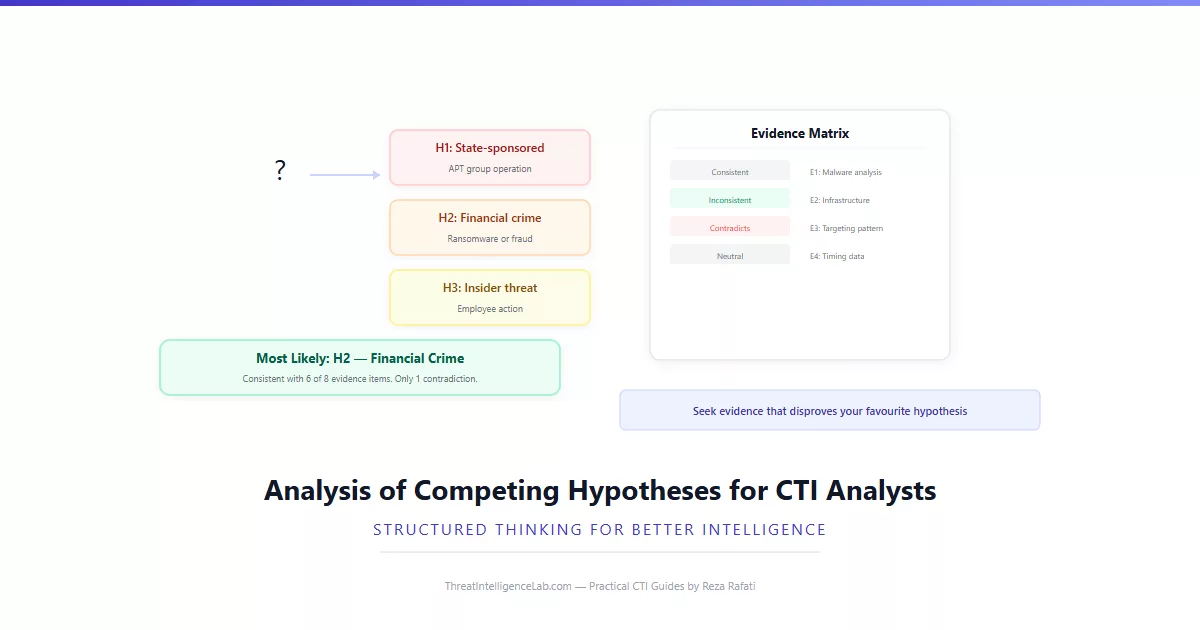
ACH is not something you use on every alert. It is what you use when the stakes are high – an attribution assessment, a campaign analysis, a board briefing on strategic threats. Reserve it for assessments where being wrong has consequences. For daily tactical analysis, the Diamond Model is faster and sufficient. For understanding attack progression, the Cyber Kill Chain handles the tactical view.
Build ACH into your quarterly intelligence production cycle. When you publish a threat landscape report or an actor profile, include an ACH appendix showing how you reached your conclusions. It demonstrates analytical rigour to stakeholders who may not understand CTI methodology but recognise structured thinking when they see it. For the next step, the threat actor profiling guide shows how ACH outputs feed directly into finished adversary profiles.
Leave a Reply
You must be logged in to post a comment.