
Introduction
Every CTI analyst starts their day the same way: logging into the threat intelligence platform to check what the feeds delivered overnight. Thousands of new indicators – IP addresses, domain names, file hashes, URLs. Most of it is noise. Some of it is stale. A fraction of it is genuinely actionable and relevant to your organization.
Your job is to find that fraction and turn it into something your SOC can use. This guide covers the full lifecycle of threat intelligence feed management – how to evaluate feed sources before you subscribe, how to curate and enrich indicators so they are actually useful, how to deduplicate at scale, and how to operationalize feeds into detection rules that block real attacks without flooding your analysts with false positives.
I have built and managed threat feed pipelines processing over 2 million indicators daily for financial services and technology clients. The principles in this guide come from that experience – what worked, what failed, and what I wish someone had told me when I started. For foundational CTI concepts, see the CTI Capability Maturity Model.
Understanding Threat Feed Sources: What You Actually Get from Each Type
Not all threat feeds are created equal. I categorize feeds into four tiers based on how they are sourced, how reliable they are, and what kind of intelligence they provide. Understanding these tiers prevents you from paying for a feed that delivers the same data you could get for free.
Open Source Intelligence feeds. These are free, publicly available feeds maintained by security researchers, non-profits, and community projects. Examples include Abuse.ch, AlienVault OTX, and the CISA Known Exploited Vulnerabilities list. OSINT feeds are abundant and cover broad threat landscapes. The downside is noise – they aggregate data from multiple sources with varying quality control. Expect 60-80% of OSINT indicators to be irrelevant to your environment or already expired.
Commercial threat feeds. These are paid subscriptions from vendors like CrowdStrike, Recorded Future, and Mandiant. Commercial feeds are curated by dedicated research teams who validate indicators before publishing. They typically include context – which threat actor uses this infrastructure, what campaign it is associated with, and how confident the vendor is in the indicator. The quality is higher than OSINT, but the indicators are often the same ones appearing in free feeds 24-48 hours later. You are paying for curation speed and analyst context, not exclusive data.
ISAC and ISAO feeds. Information Sharing and Analysis Centers are industry-specific threat sharing communities – FS-ISAC for financial services, H-ISAC for healthcare, and others. These feeds contain intelligence shared by peers in your sector. The signal-to-noise ratio is typically the highest of any feed type because the data is sector-relevant and vetted by organisations facing the same threats you face. The limitation is access – you must be a member, and members are expected to contribute intelligence, not just consume it.
Internal telemetry feeds. This is the most valuable data you have and the most underutilized. Your own firewalls, proxies, EDR, and email gateways generate enormous volumes of threat data. An IP address that triggered a block on your firewall is infinitely more relevant than an IP address from a public blocklist, because it represents a threat that actually targeted your environment. Building an internal feed pipeline from your existing telemetry is the highest-ROI activity in feed management. Everything else is supplementary.
Curation: Turning a Million Indicators into a Thousand That Matter
The raw feed pipeline I managed processed over 2 million indicators daily. After curation, roughly 12,000 survived. That is a 99.4% reduction. Curation is not optional – without it, you are feeding noise into your detection systems and wasting analyst hours investigating false positives.
Curation has three stages. Stage one: relevance filtering. Does this indicator target our industry, our geography, or our technology stack? An IP address associated with attacks on healthcare organizations is irrelevant if you are in manufacturing. A phishing domain targeting a banking application you do not use is irrelevant. Most feed platforms let you filter by sector and technology tags. Use them aggressively. I discard roughly 70% of incoming indicators at this stage.
Stage two: freshness validation. Indicators have a shelf life. An IP address used in a campaign six months ago is probably no longer malicious. A domain registered for a phishing attack two years ago has likely expired. I use a sliding scale: IP addresses are considered fresh for 30 days, domains for 90 days, and file hashes indefinitely (malware samples remain relevant for analysis even if the campaign is old). Discard anything outside these windows unless you have specific reason to retain it.
Stage three: confidence scoring. Every indicator should carry a confidence score – high, medium, or low – based on how many independent sources report it and how recently it was confirmed. I use a simple rule: high confidence requires at least three independent sources within the last 7 days. Medium requires two sources within 14 days. Low is a single source or older confirmations. High-confidence indicators go directly to operationalization. Medium-confidence go to a review queue. Low-confidence are logged but not actioned unless corroborating evidence appears later.
Enrichment: Adding the Context That Makes an IoC Actionable
A raw IP address is almost useless. An IP address tagged with the associated threat actor, campaign name, malware family, and target sector is intelligence. Enrichment transforms the former into the latter. I run every surviving indicator through a standard enrichment pipeline before it reaches the operationalization stage.
WHOIS and passive DNS. Every domain and IP gets a WHOIS lookup and passive DNS query. WHOIS tells you who registered the domain and when. A domain registered three days ago pointing to infrastructure in a high-risk country is more suspicious than a domain registered five years ago that was recently compromised. Passive DNS shows you what other domains resolve to the same IP – revealing adversary infrastructure clusters you did not know about.
Geolocation and ASN. Where is this IP hosted, and who owns the autonomous system? An IP in a bulletproof hosting provider with a history of hosting malware is more concerning than an IP in a major cloud provider that was likely compromised. Tag indicators with geolocation and ASN data so your SOC can prioritise based on risk profile.
Threat actor and campaign mapping. Cross-reference the indicator against threat intelligence platforms and research reports. Which actor uses this infrastructure? Is this part of an active campaign? Tagging indicators with actor and campaign context lets your SOC understand not just what to block but why – which transforms a mechanical block into an intelligence-driven defence.
The enrichment tools I rely on most are PassiveTotal for DNS and WHOIS, VirusTotal for file and URL lookups, and Shodan for infrastructure profiling. Each has an API, and the enrichment pipeline should be automated. Manual enrichment does not scale beyond a few hundred indicators per day. For guidance on building detection rules from enriched indicators, see the Threat Intelligence Brief series for real-world examples of operationalized threat data.
Deduplication at Scale: Why It Matters and How to Do It Right
When you ingest feeds from multiple sources, you will receive the same indicators repeatedly. A phishing domain reported by OSINT feed A on Monday will appear in commercial feed B on Tuesday and ISAC feed C on Wednesday. Without deduplication, your operational pipeline processes the same indicator three times.
Deduplication sounds simple but has subtleties that matter. Two feeds may report the same IP address but with different contextual data – Feed A attributes it to APT29, Feed B to Cozy Bear, which is the same actor under a different name. Your deduplication logic must recognise these as the same indicator and merge the contextual data rather than discarding one source’s enrichment.
This is where a Threat Intelligence Platform with entity resolution capabilities pays for itself. MISP handles this through its correlation engine. Commercial TIPs like ThreatConnect and Anomali have native deduplication with configurable merging rules.
For teams without a dedicated TIP, you can build a basic deduplication pipeline using a database with unique constraints on indicator values. Store the raw indicator in one table and contextual tags in a related table. When a new indicator arrives, check if it already exists. If it does, update the tags rather than creating a duplicate. This approach scales to a few hundred thousand indicators before you need a more robust solution.
Operationalization: Turning Curated IoCs into Detection Rules That Actually Work
You have filtered, enriched, and deduplicated your indicators. They are high-confidence, relevant to your sector, and tagged with threat actor context. Now you need to turn them into something your defences can use. This is operationalization, and it is where most feed pipelines fail. A blocklist that generates 50 false positives a day will be disabled by your SOC within a week.
The key principle is risk-tiered deployment. Not every indicator should go to the same enforcement point. I use three tiers. Tier one – firewall and proxy block. High-confidence IP addresses and domains with threat actor corroboration go to network-level blocks. These indicators have been validated by multiple sources and are actively malicious. The risk of a false positive blocking legitimate business traffic is low.
Tier two – SIEM alert. Medium-confidence indicators and indicators older than 14 days go to SIEM correlation rules. They generate alerts rather than blocks. Your SOC sees them, investigates, and decides whether to escalate to a block. This tier catches threats that might have been missed by automated blocks while giving analysts control over the final decision.
Tier three – threat hunting. Low-confidence indicators, indicators from a single source, and historical indicators go to threat hunting hypotheses. Your hunters use them to search for evidence of past compromise – an IP address that appeared in your logs six months ago, a domain that was resolved internally before it was flagged. This tier generates no alerts and no blocks. It feeds proactive investigation.
Track the false positive rate for each tier monthly. If tier-one blocks generate more than 1% false positives, move those indicators to tier two. If tier-two alerts are dismissed without investigation more than 50% of the time, your medium-confidence threshold is too low. Tighten it. The goal is not to block everything. It is to block the right things without burning out your SOC.
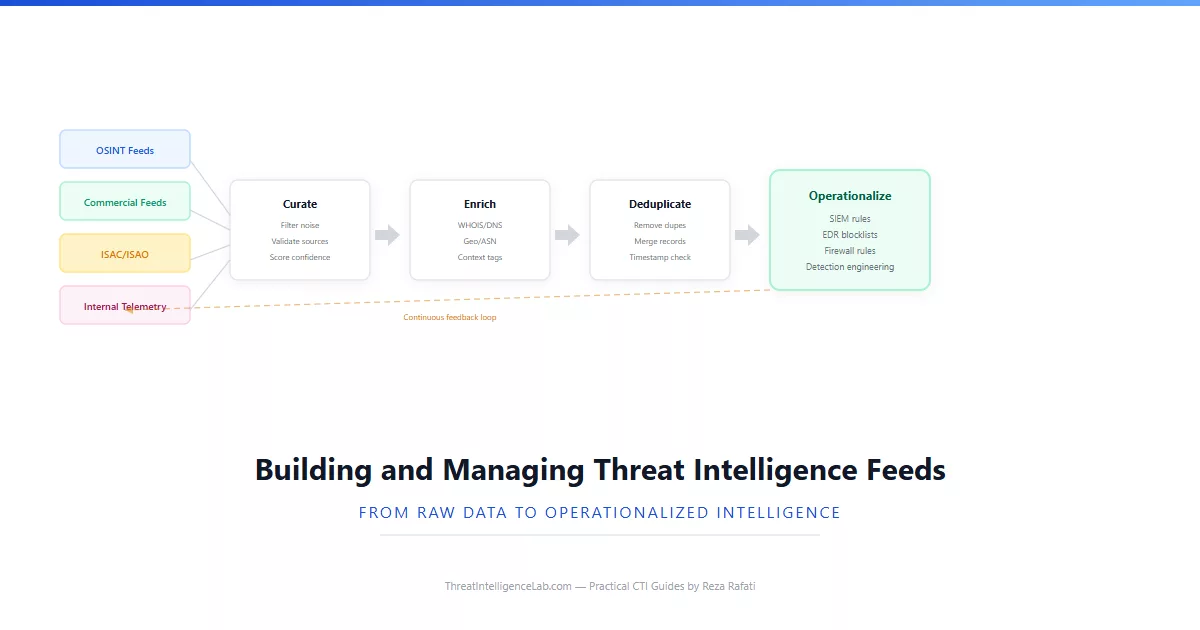
Managing threat intelligence feeds is not a one-time setup. It is a continuous process of tuning, measuring, and refining. Review your feed sources quarterly. Drop feeds that consistently produce low-value indicators. Add feeds that cover blind spots in your threat landscape. Recalibrate your confidence thresholds based on real-world false positive data from your SOC. The goal is a pipeline that gets quieter and more precise over time – fewer indicators in, fewer false positives out, higher detection rates from the indicators you keep.
For the next step in your CTI journey, the CTI Capability Maturity Model will help you assess where your feed management practices sit on the maturity ladder and what to tackle next. If you are building detection rules from these feeds, the AI-assisted exploitation guide covers the evolving threat landscape your feeds need to detect.
Leave a Reply
You must be logged in to post a comment.